Kernel Debugging
Full Kernel Debuggers
Establishing communication for comprehensive kernel debugging within a virtual machine offers various options. This article will guide you through the process of setting up communication with a COM device exposed to the host system as a named pipe
Ensure that secure boot is disabled in the virtual machine!
In an Elevated Command Prompt, execute the following commands:
bcdedit /debug on
VM setup (COM)
bcdedit /dbgsettings serial debugport:1 baudrate:115200
Let's break down the components:
-
/dbgsettings: This flag indicates that debugging settings are being configured
-
serial: Specifies the type of debugging connection, in this case, a serial connection
-
debugport:1: Sets the debug port to 1. The debug port is a crucial parameter as it designates the communication channel through which debugging information is transmitted
-
baudrate:115200: Establishes the baud rate for the serial connection at 115200. Baud rate is the speed at which data is transmitted, and in debugging scenarios, it is set to ensure efficient and reliable communication between the virtual machine and the debugging tools
After completing the debugging configuration, shut down the virtual machine
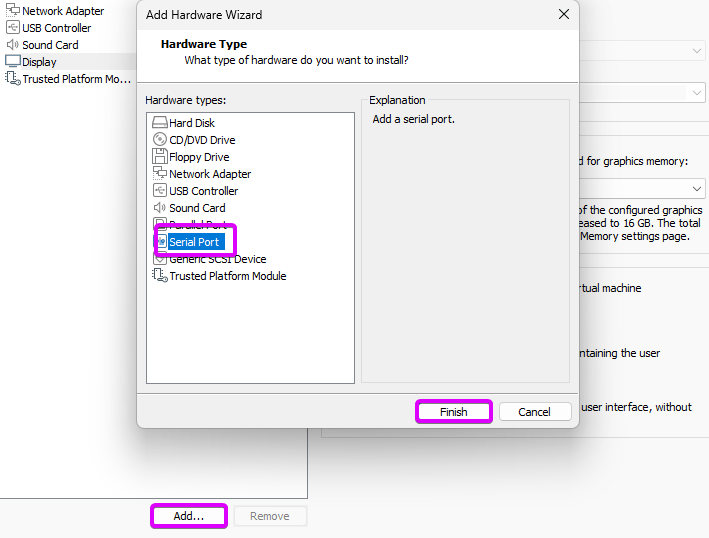
In VMware, you can add a virtual COM device to the VM. To do this, navigate to the VM settings. Look for the option to add hardware, and choose "Serial Port" from the list
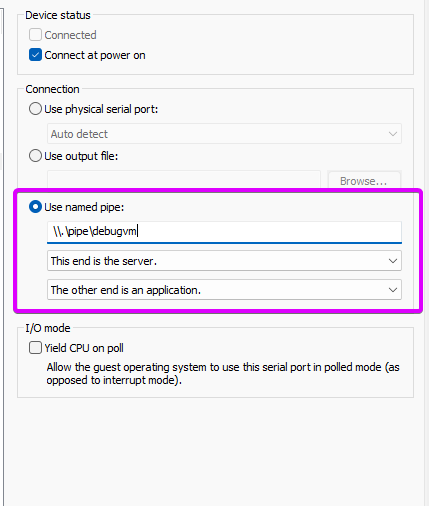
Once you've added the virtual serial port, configure it to use a named pipe
This establishes a communication channel with the host system
In the settings, specify the pipe name for the COM device (\\.\pipe\debugvm)
For further assistance on configuring named pipes in VMware, refer to the VMware documentation
Start the virtual machine and ensure that the virtual COM device is correctly connected
WinDBG (COM)
-
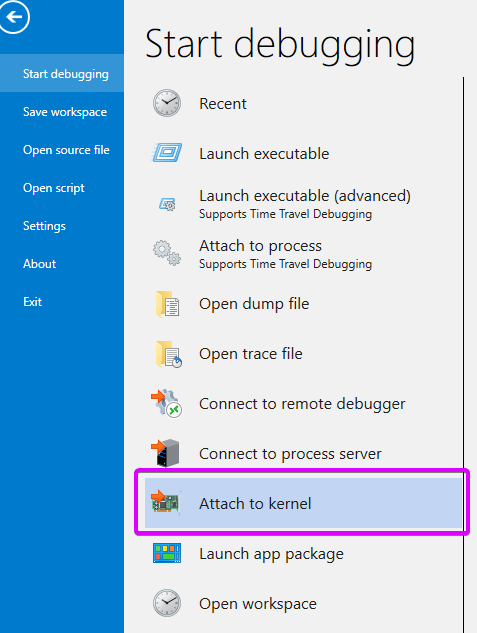
Launch WinDbg and navigate to the "File" menu located in the top left corner
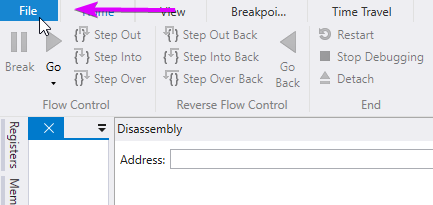
-
Select "Attach to Kernel" from the menu options
-
In the COM settings, enter the port you defined in VMware (
\\.\pipe\debugvm).
Additionally, set the baud rate to115200. Click "OK" to confirm the configuration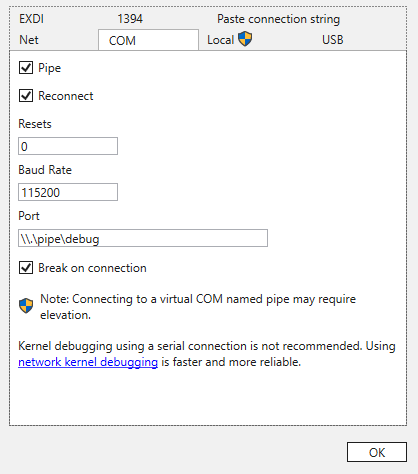
VM setup (Net)
bcdedit /dbgsettings net hostip:<ip> port:<port>
-
/dbgsettings net: This flag indicates that network debugging settings are being configured. -
hostip:<ip>: Specifies the IP address of the host machine that will be used for network debugging. Ensure that this IP address aligns with the host machine's network configuration. -
port:<port>: Sets the port number for the network debugger connection. The chosen port, in this case, is51234( Should be 49152 or higher)
example:
bcdedit /dbgsettings net hostip:192.168.56.1 port:51234
WinDBG (Net)
In the NET settings, enter the port you defined (51234). Additionally, set the baud rate to 115200. Click "OK" to
confirm the configuration

The encryption key is generated automatically when you run the bcdedit command.
Alternatively, you have the option to manually define the key using the key:<key> parameter
bcdedit /dbgsettings net hostip:192.168.56.1 port:51234 key:1.3.3.6
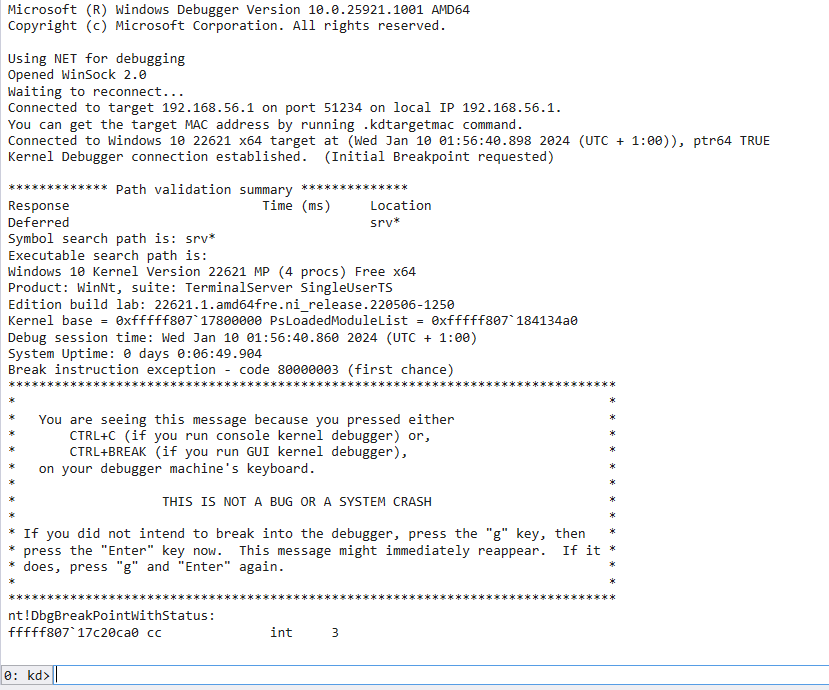
Additionally, note that the virtual machine will remain in a "frozen" state until you remove the breakpoint and resume
execution using either F5 or g in the command line
Basic usage of WinDbg
For a quick reference guide to WinDbg commands and usage,
check out the WinDbg Cheat Sheet by repnz.
Breakpoints
- Set Breakpoint:
bpfollowed by the address or symbol - Clear Breakpoint:
bcfollowed by the breakpoint number
Execution Control
- Run (Continue Execution):
gor F5 - Step Into:
por F11 - Step Over:
tor F10 - Step Out:
gu
Stack
- View Stack:
korkb - Set Stack Frame:
frame <frame number>
Modules and Symbols
- List Loaded Modules:
lm - Reload Symbols:
.reload
Control Flow
- Set Next Statement (Jump):
j <address>
Thread Control
- Switch Thread:
~<thread number>s - View All Threads:
~
Symbols
SRV*c:\Symbols*http://msdl.microsoft.com/downloads/symbols
set the symbols path to this value either by using the registry key or the options in windbg (File > Settings >
Debugging Settings > Sybmols Path)
Debugging ur Kernel Driver
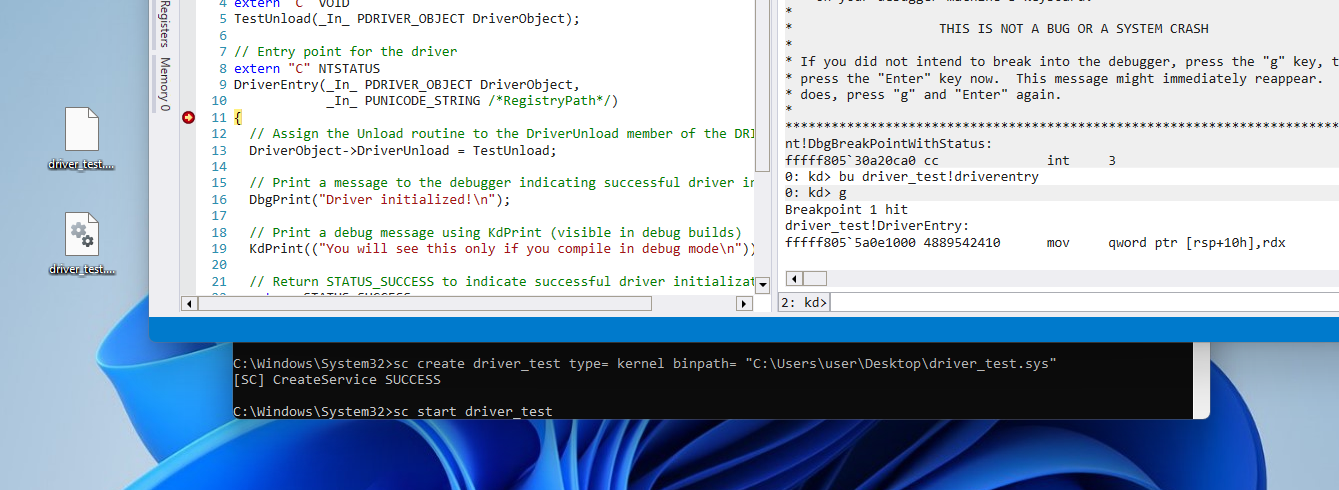
To set a breakpoint at the driver entry, use the bu (unresolved breakpoint) command
This is particularly useful when setting a breakpoint on code that has not yet been loaded,
such as our driverentry function
In this example, usebu driver_test!driverentry
Replace 'driver_test' with your driver name
Load the driver by using sc start <drivername>